Visualizing Complex Networks
Role: Lead Product Designer (solo designer)
Scope: Entity profile graphing user experience experience critical to analyst investigations and feature of sales demos to propestive customers
Impact at a glance
- Supported closing multiple 6–7 figure enterprise deals
- Used by hundreds of high-influence / high-impact analysts, driving millions in revenue
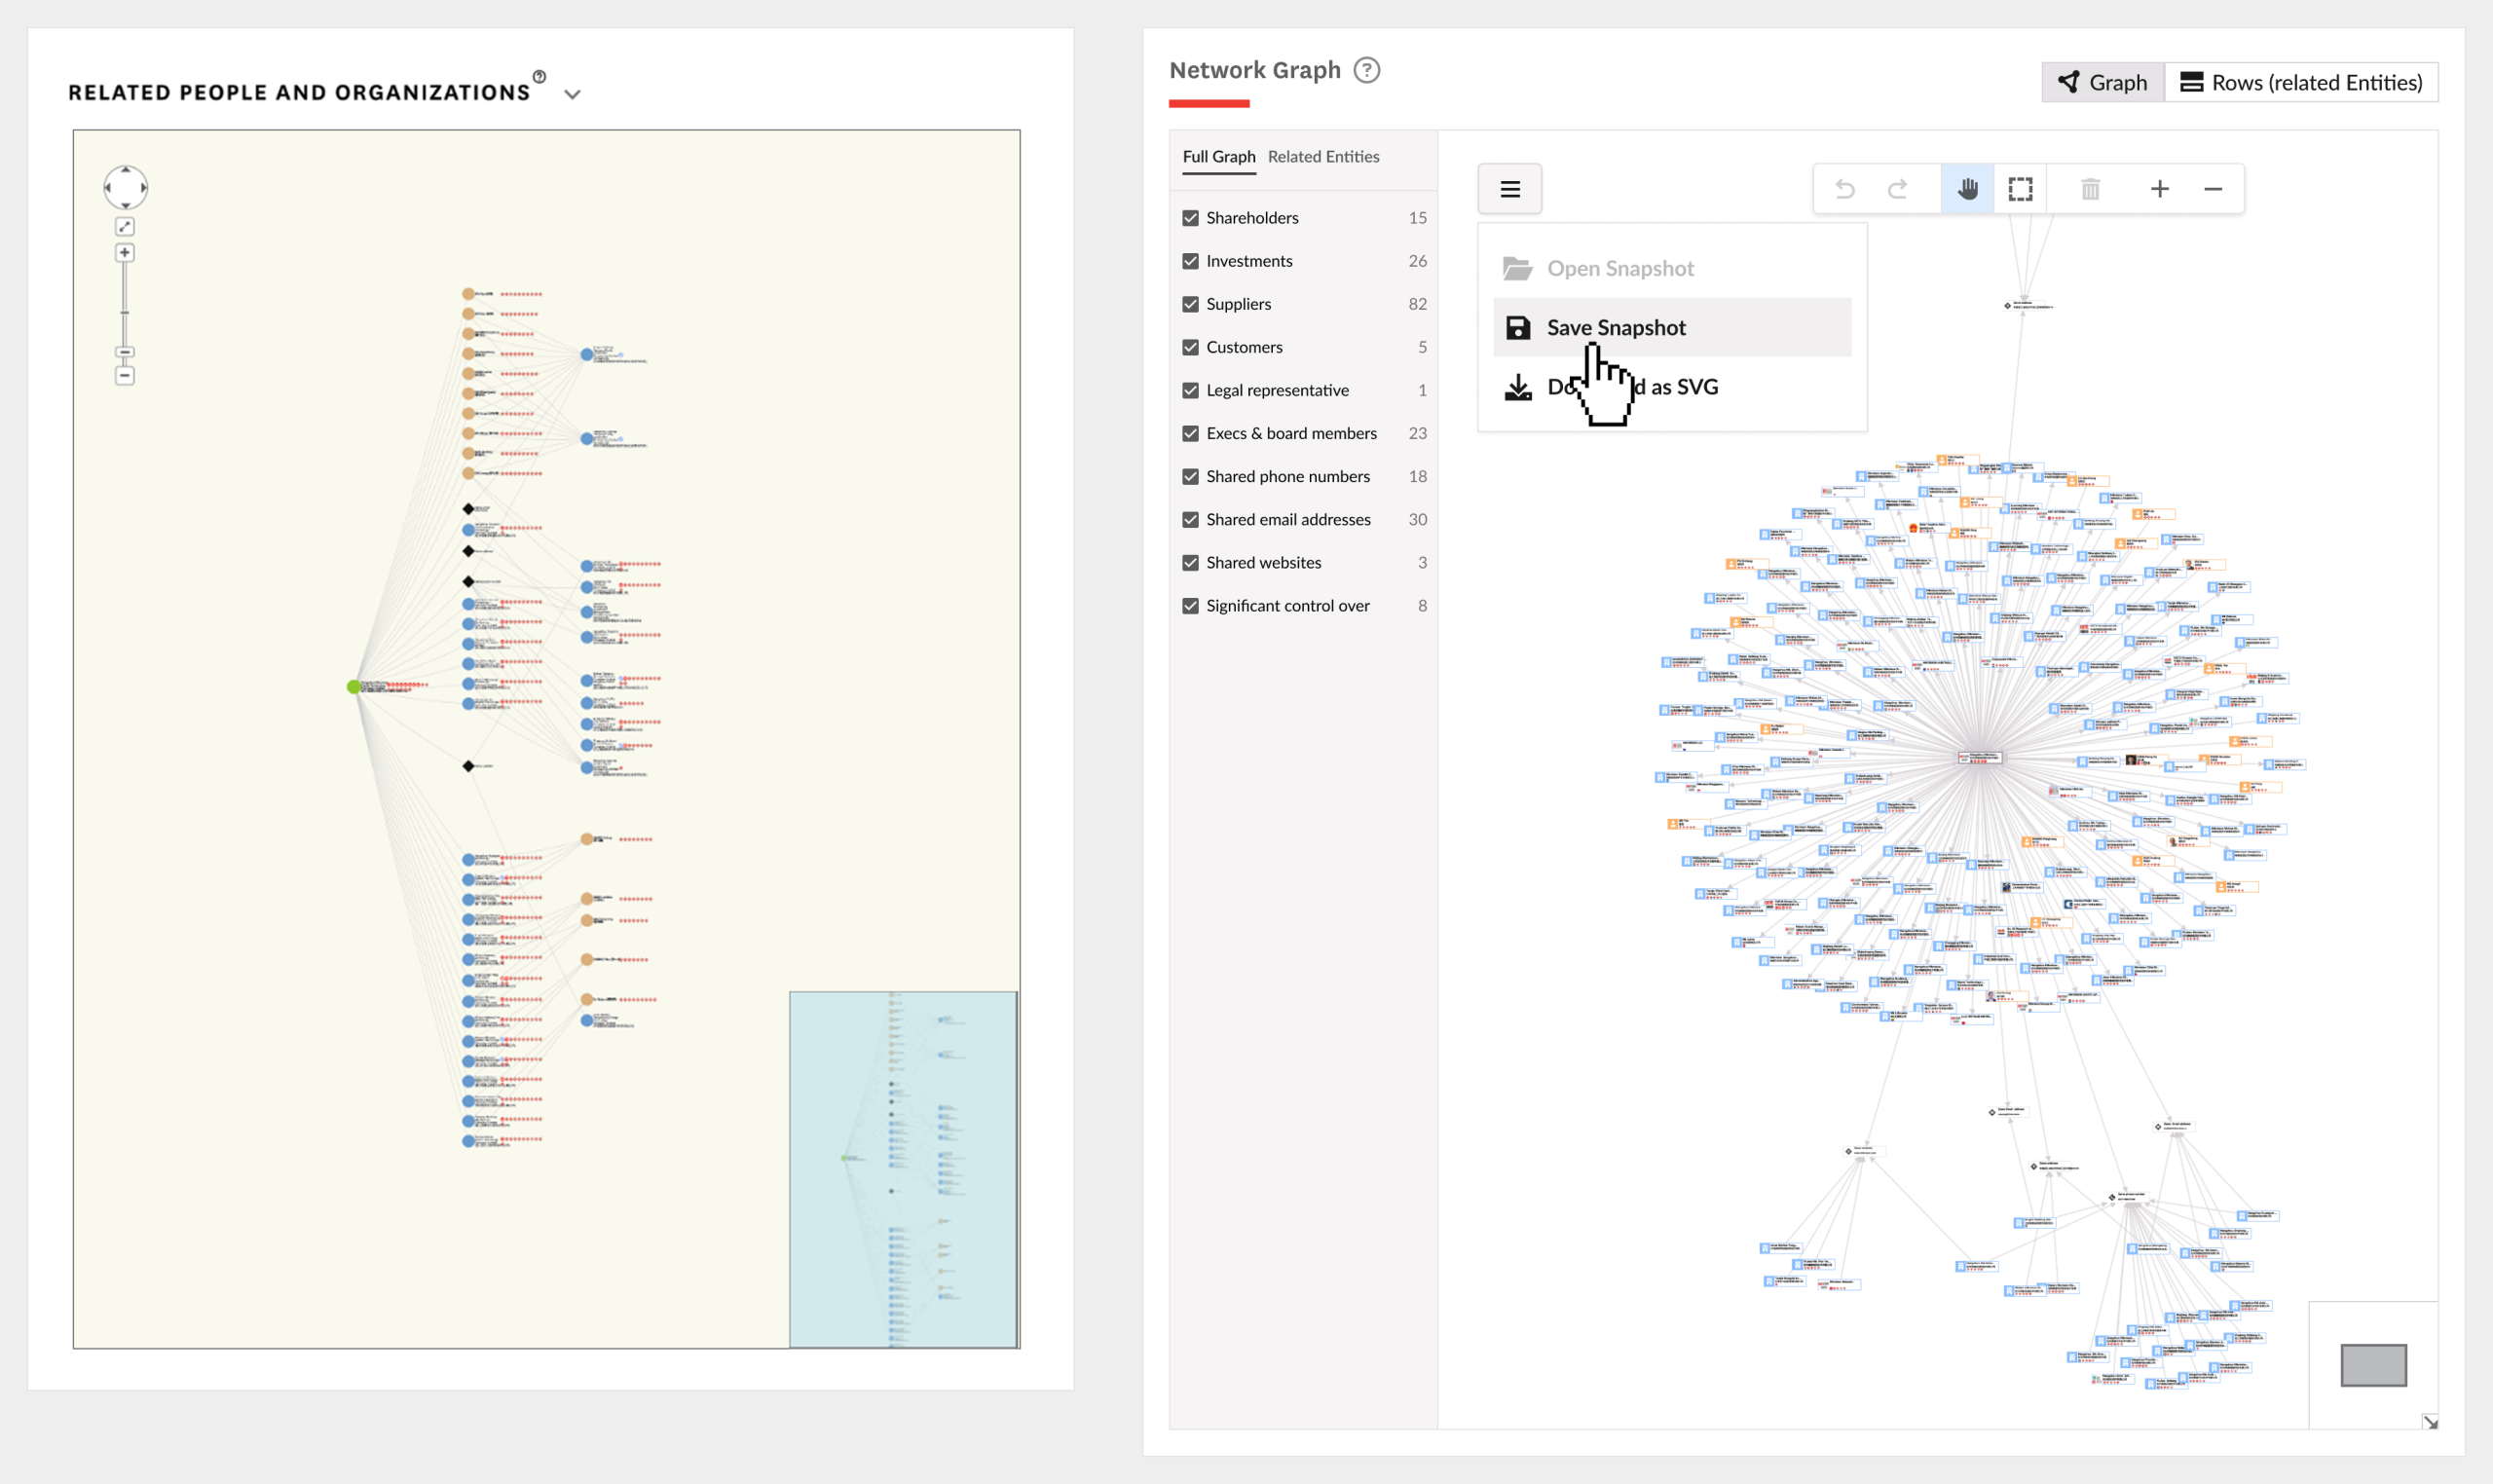
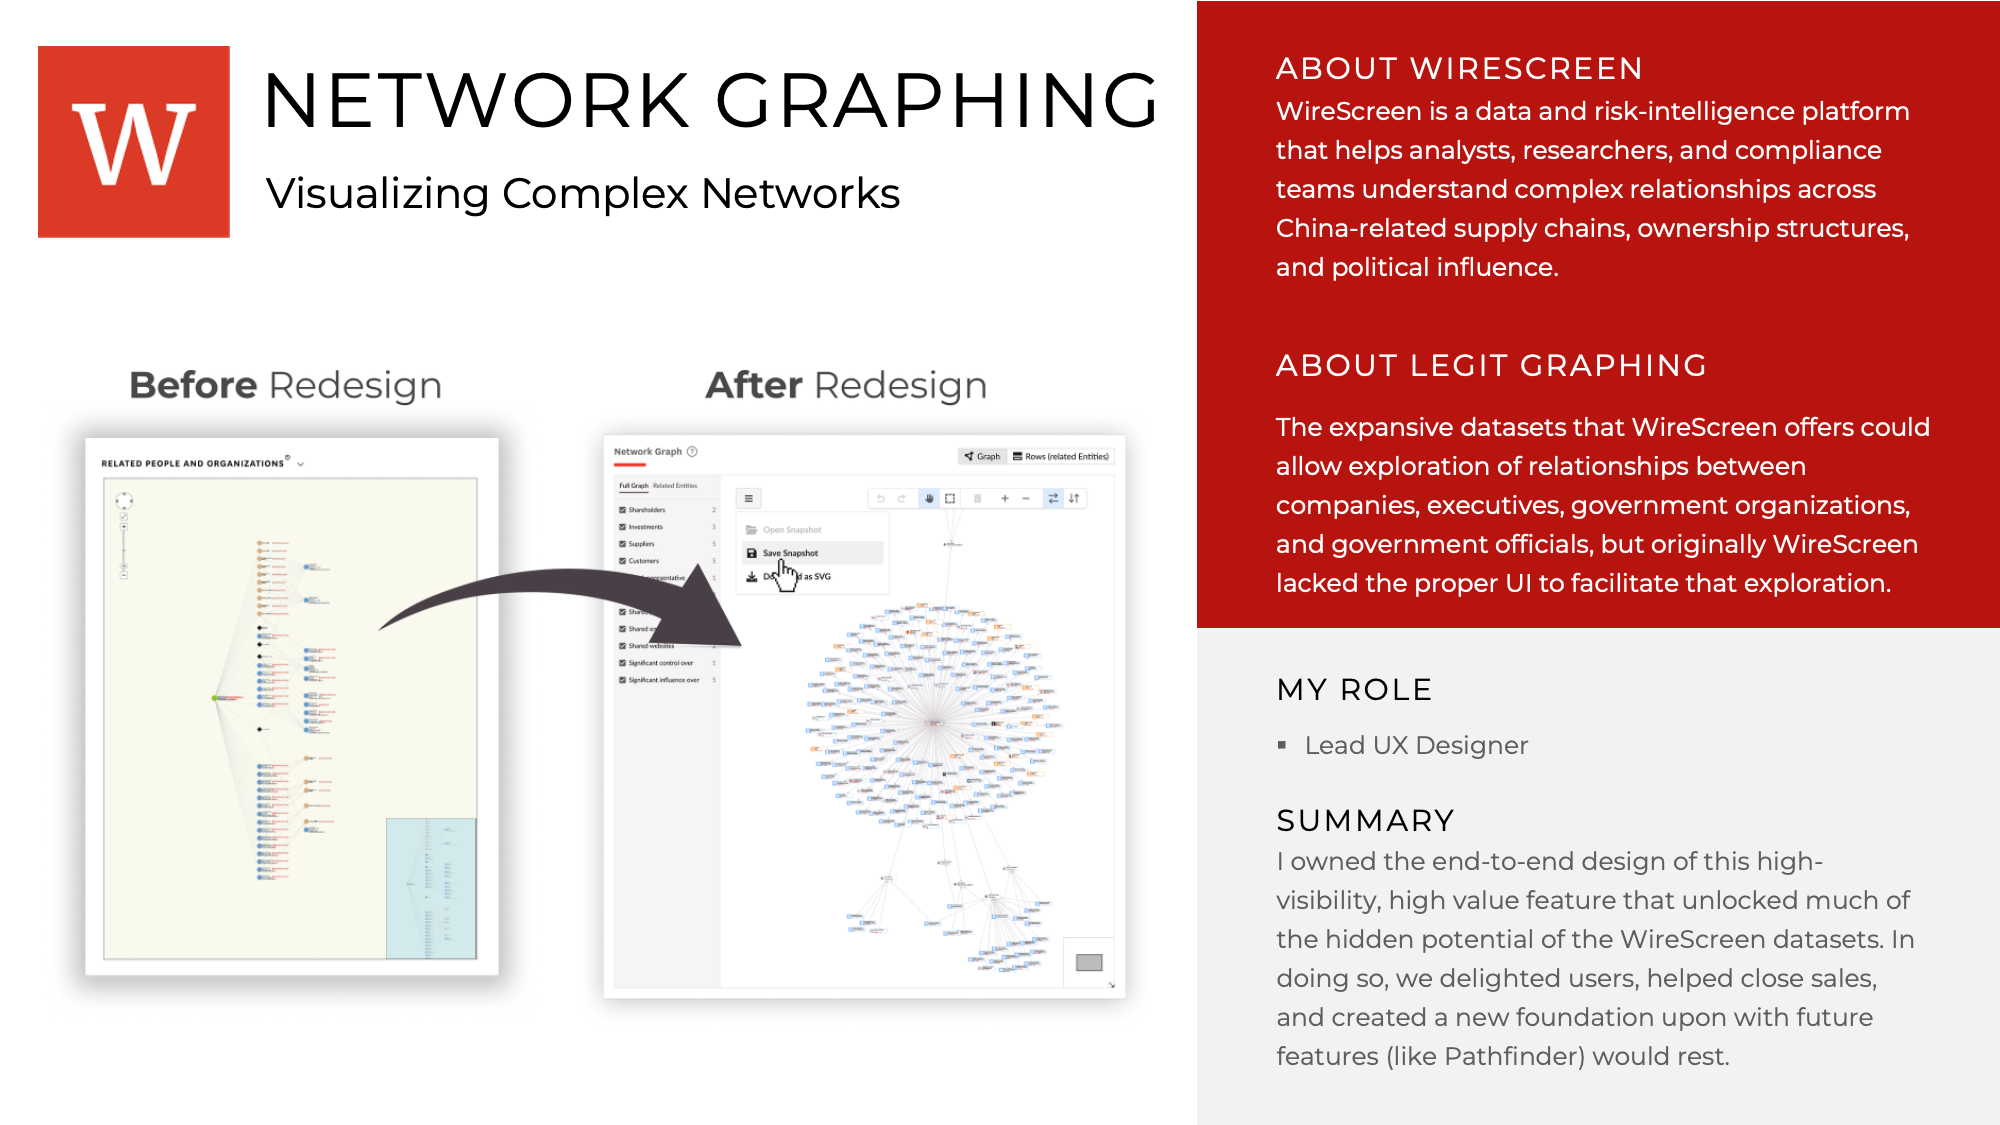
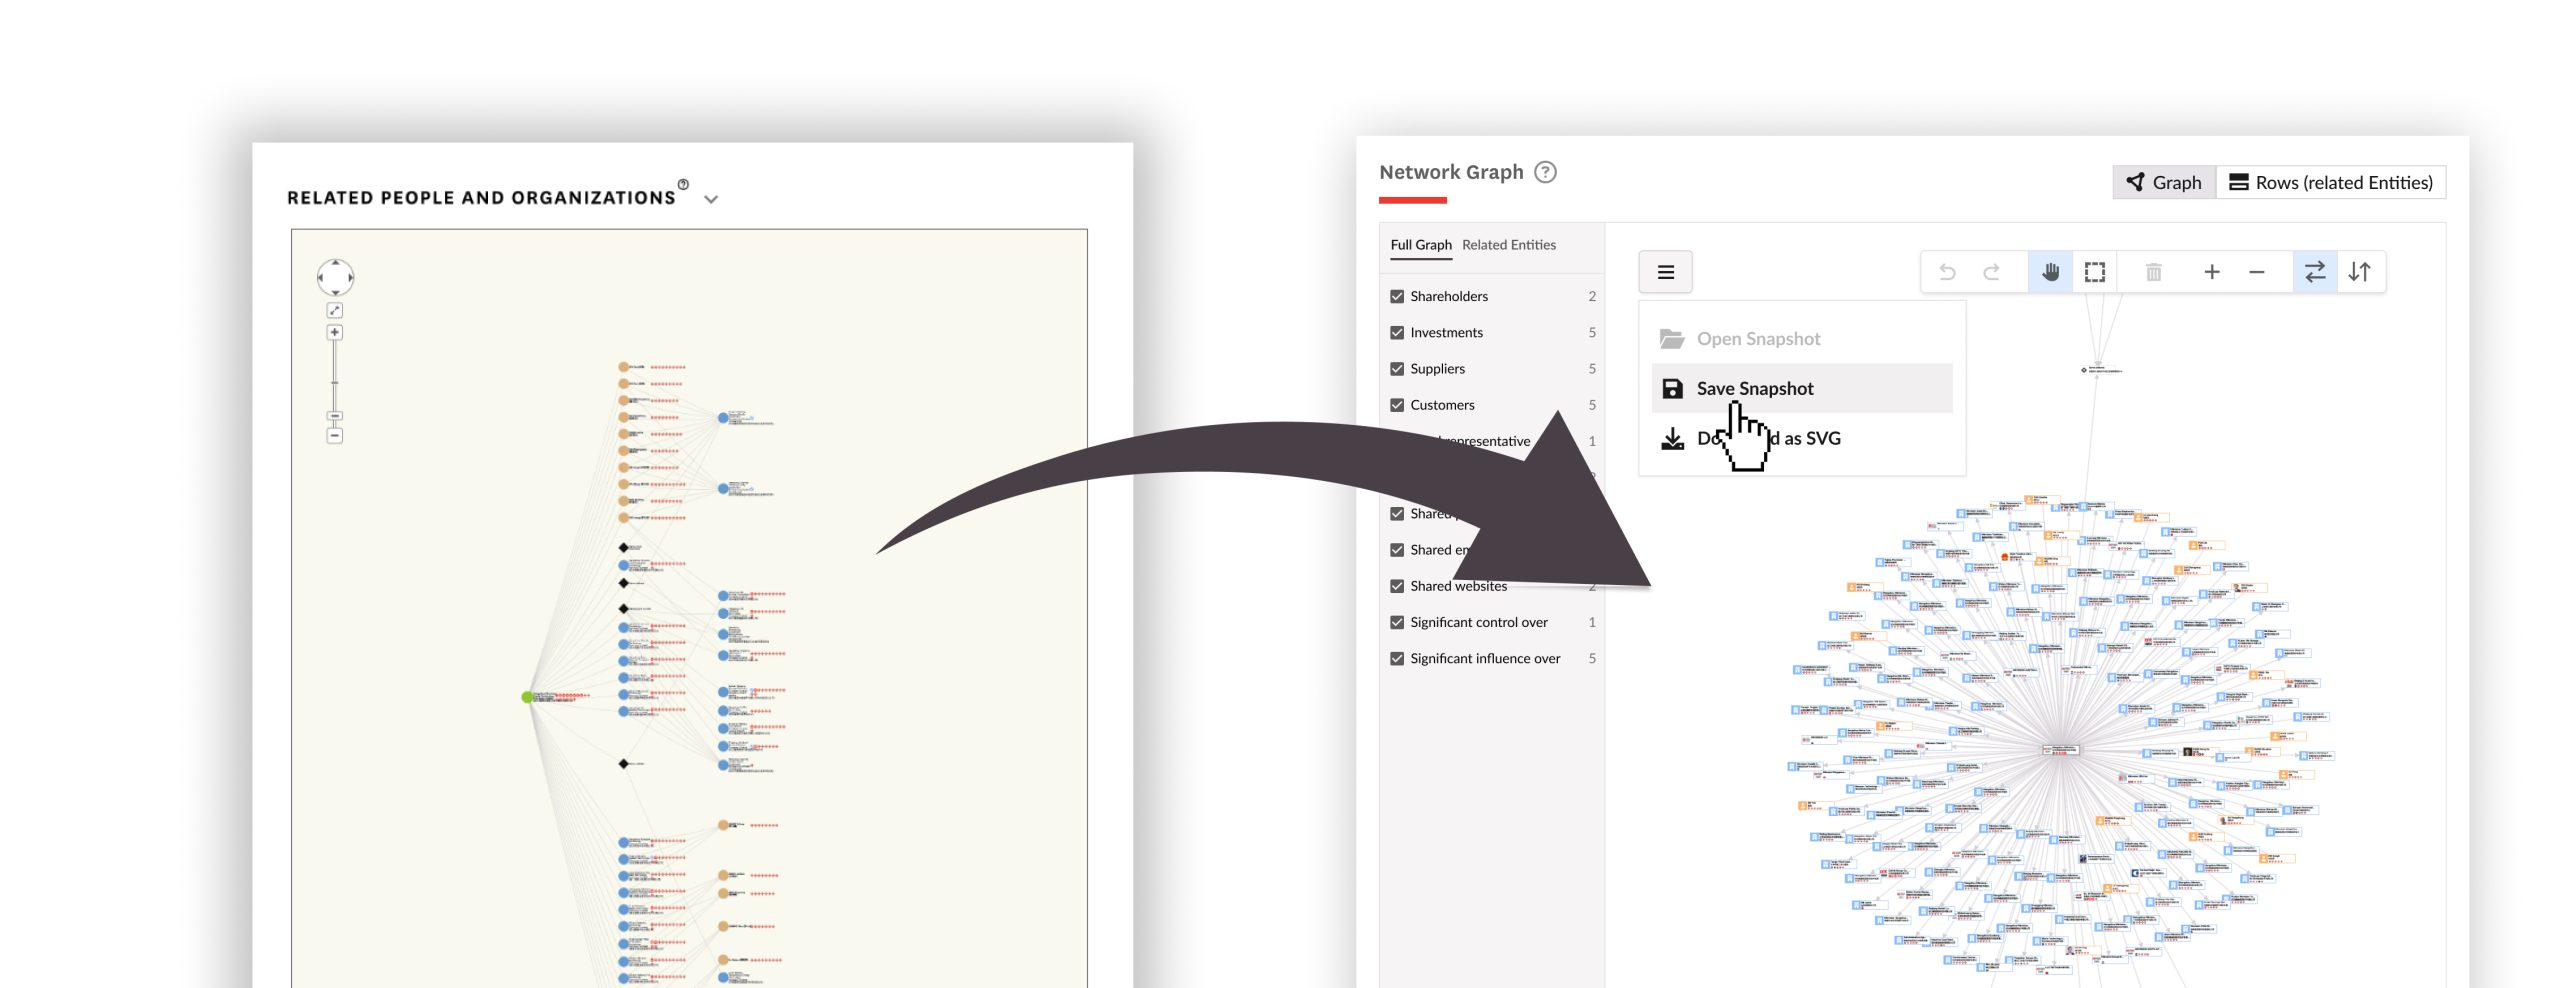
I led the redesign of the new WireScreen network graphing experience which allowed analysts to dynamically explore the WireScreen dataset, which unlocks key user workflows and opens the door to purchase justification for prospective clients in both public and private sectors. I led the redesign of the
Opportunities → Requirements
I worked with the head of product and I reviewed the current graphing feature and identifed shortcomings and opportunities. We incorported customer feedback and and guidance from our go to market leads.
- No drill-down expansion: graphing did not allow exploration of the graph -- the current graph content was static
- Lack of filtering: while the graph was helpful at times, it could quickly become unsuable for large entities -- and users had no way to reduce the graphed data
- Missing save feature: the graph allowed rearrangement / manual grouping of visible nodes, but there was no way to save your work to come back to it later
- No export capability: with no way to export the graph, users resorted to taking screenshots, and piecing large graphs back together manually, or just recreating the graph in another tool
Opportunities → Requirements
I worked with the head of product and I reviewed the current graphing feature and identifed shortcomings and opportunities. We incorported customer feedback and and guidance from our go to market leads.
- No drill-down expansion: graphing did not allow exploration of the graph -- the current graph content was static
- Lack of filtering: while the graph was helpful at times, it could quickly become unsuable for large entities -- and users had no way to reduce the graphed data
- Missing save feature: the graph allowed rearrangement / manual grouping of visible nodes, but there was no way to save your work to come back to it later
- No export capability: with no way to export the graph, users resorted to taking screenshots, and piecing large graphs back together manually, or just recreating the graph in another tool
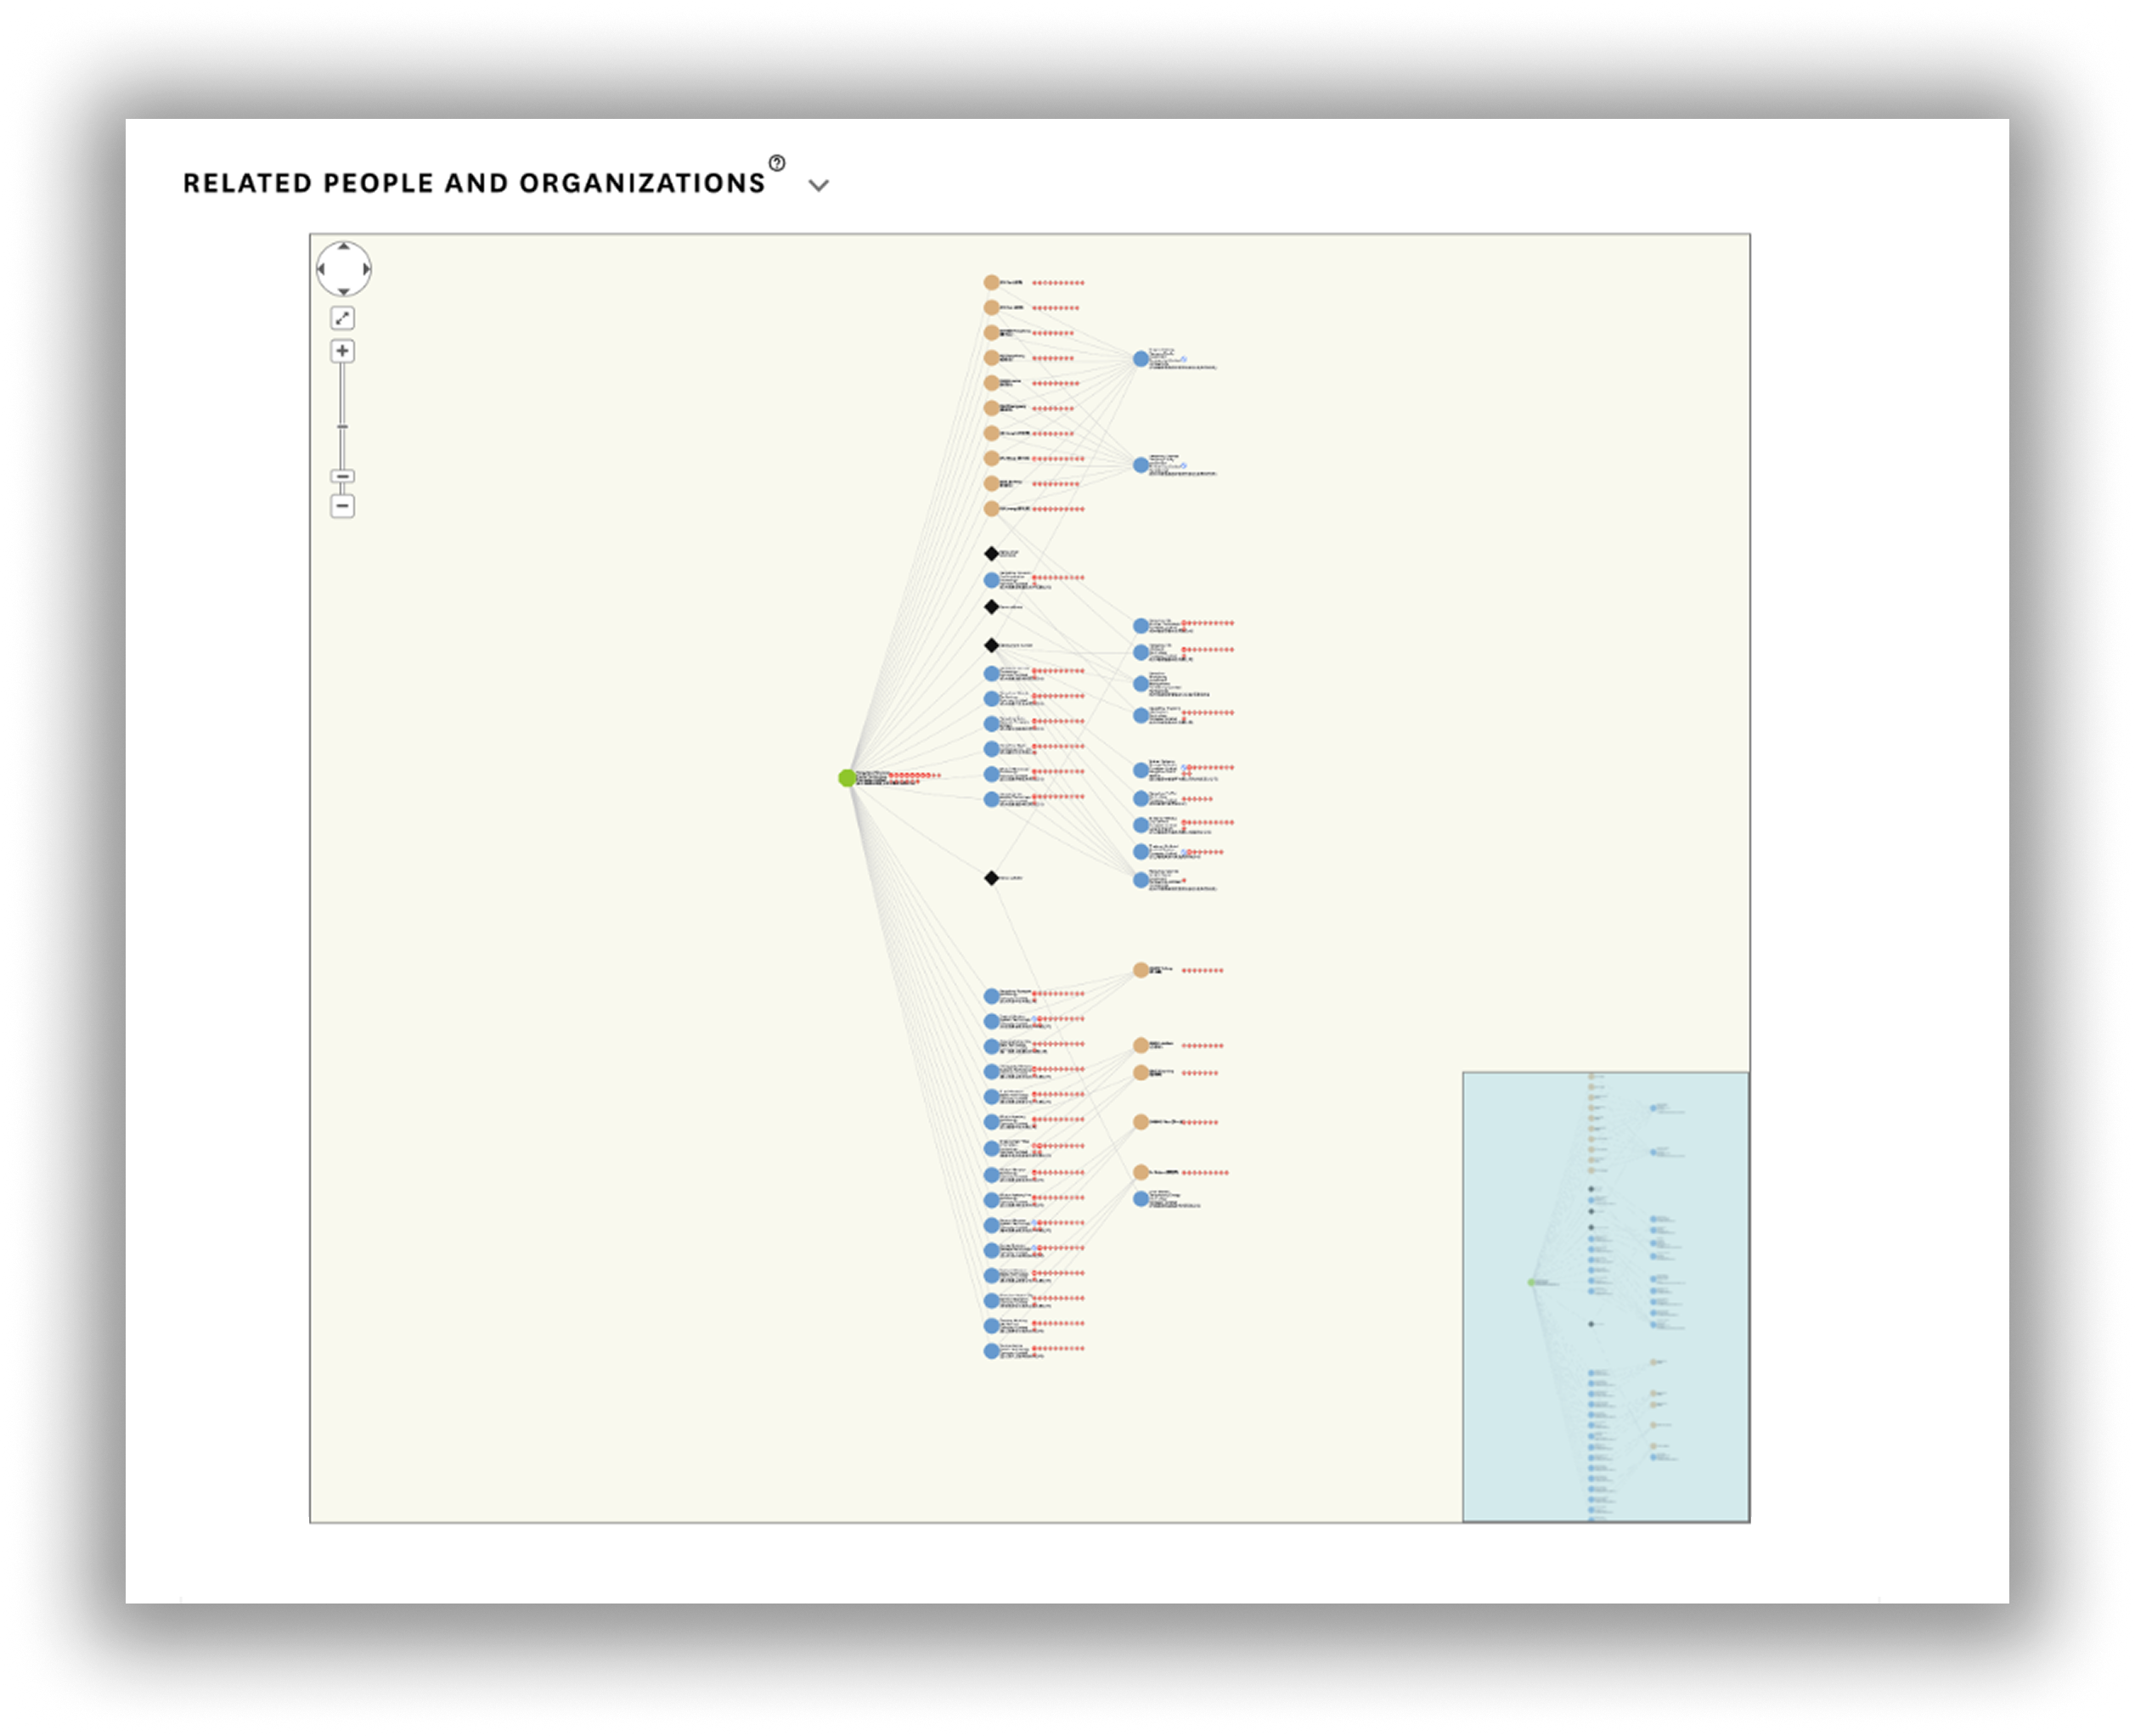
Sometimes I just skip over some of the graphs during a demo -- they can be too overwhelming to be useful.
— Pete J., Director
Goals
- Allow drill-down expansion to enable analyts exploration
- Include filtering to allow users to enable management of large networks Lack of filtering: while the graph was helpful at times, it could quickly become unsuable for large entities -- and users had no way to reduce the graphed data
- Missing save feature: the graph allowed rearrangement / manual grouping of visible nodes, but there was no way to save your work to come back to it later
- No export capability: with no way to export the graph, users resorted to taking screenshots, and piecing large graphs back together manually, or just recreating the graph in another tool
Experimenting with concepts
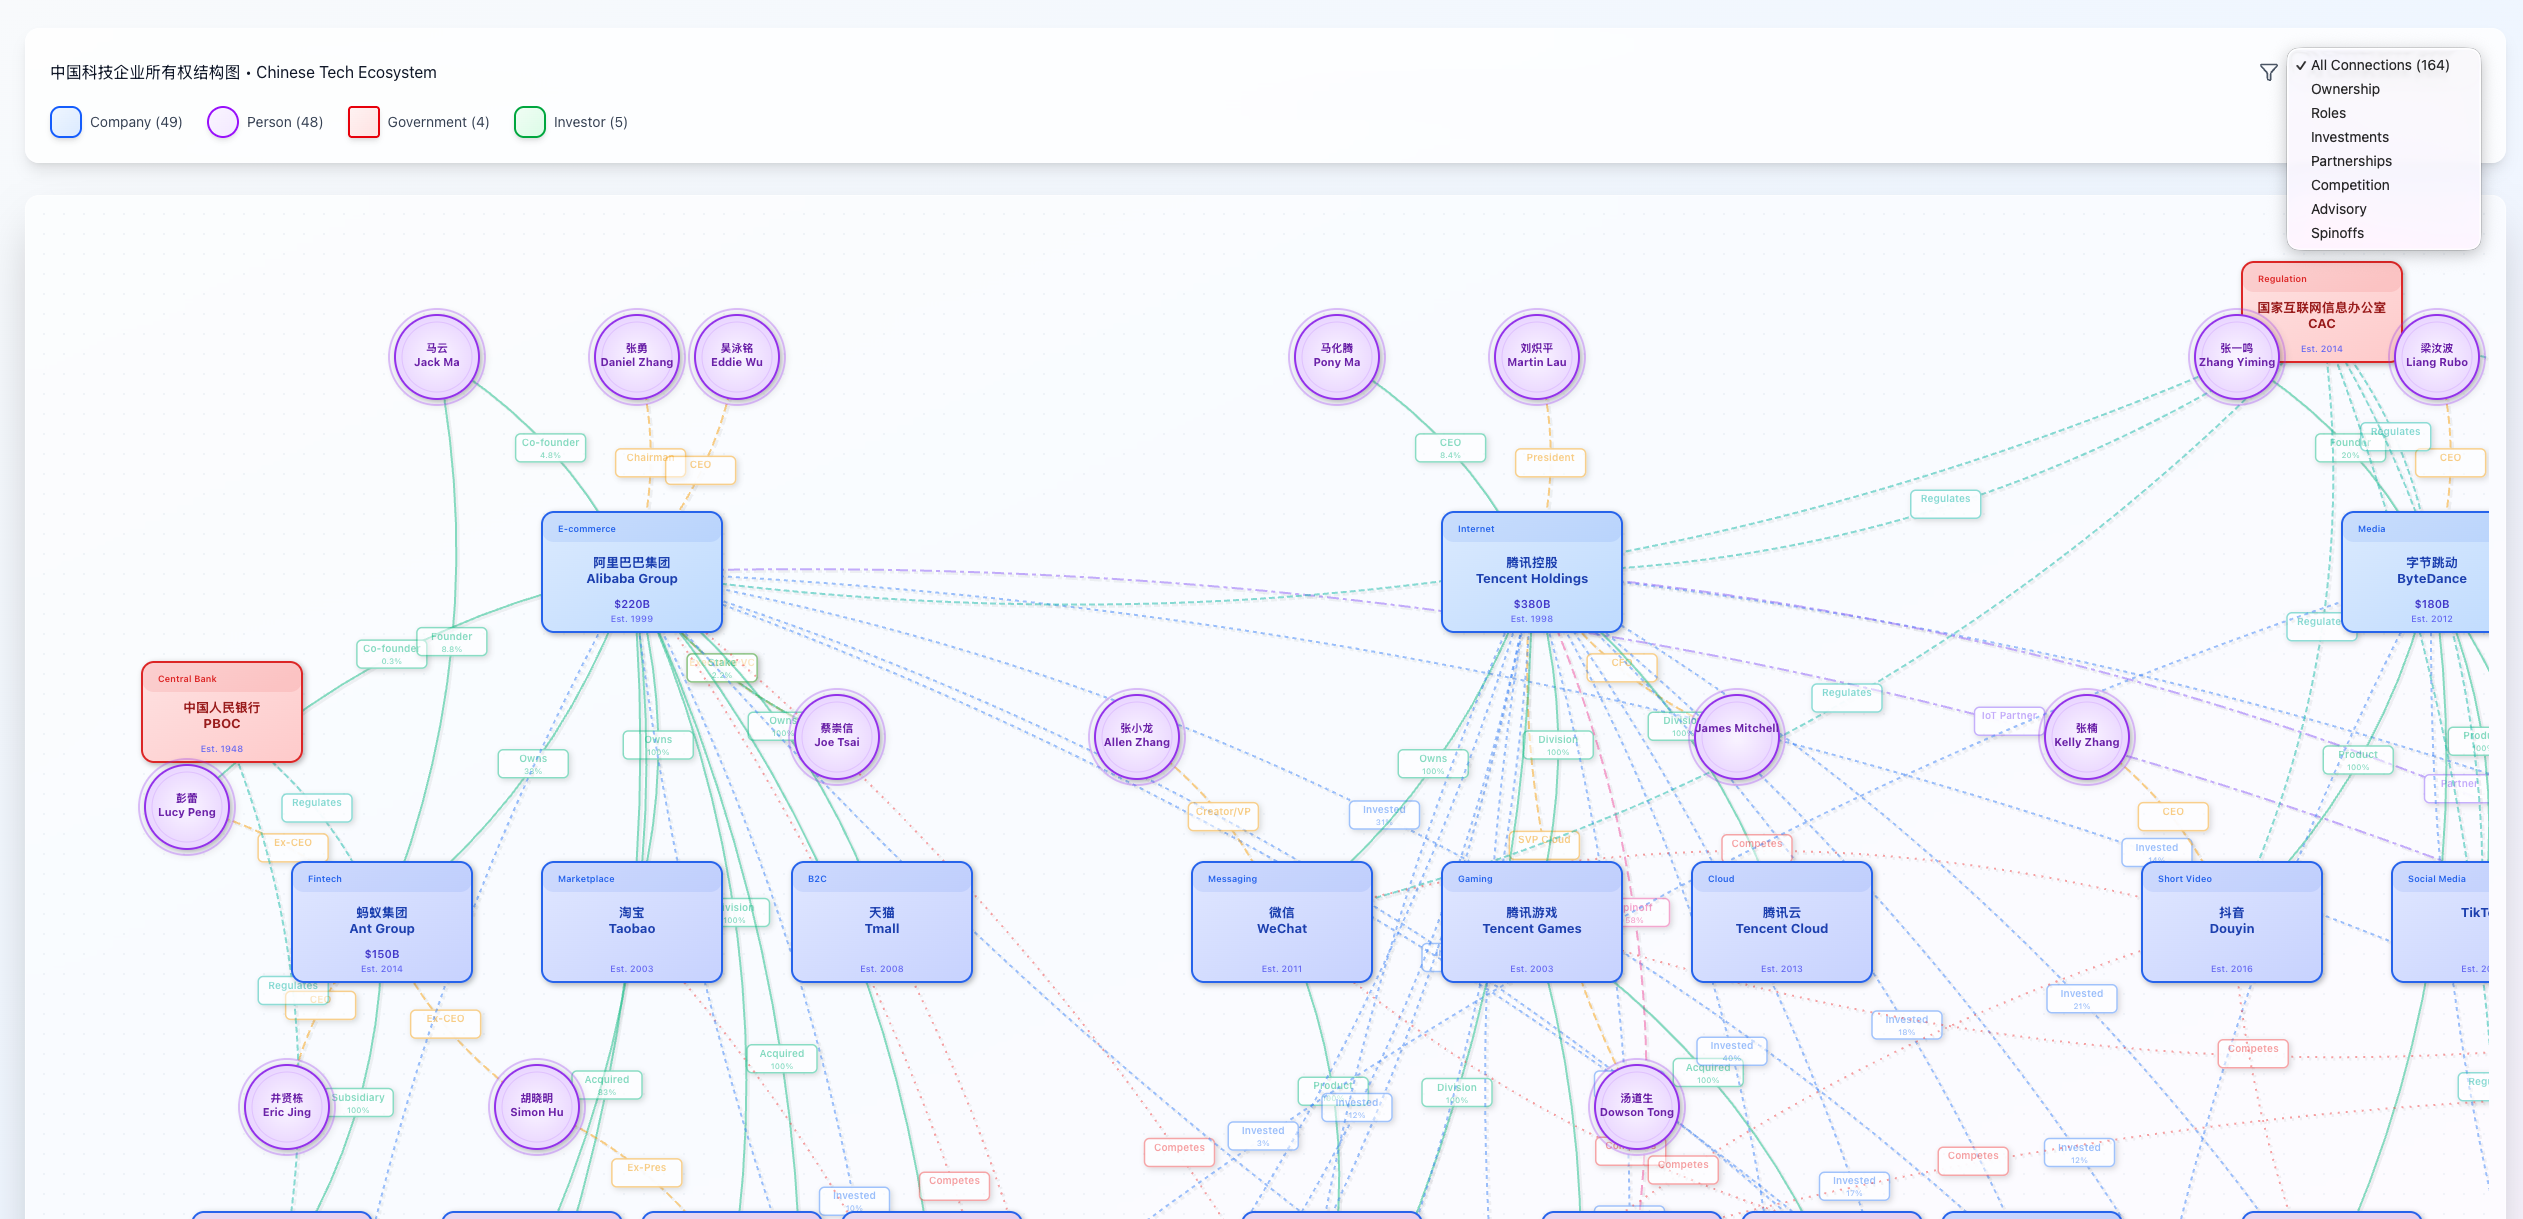
I explored different ways to display networks of entities, including complex relationships between organizations and people, expansion, filtering, and styling. I considered how the designs could be reinforced by visual cues already present on the platform (e.g., circular cropped image = person, square logo = company) and how these might translate to a visual graph.
technical foundations
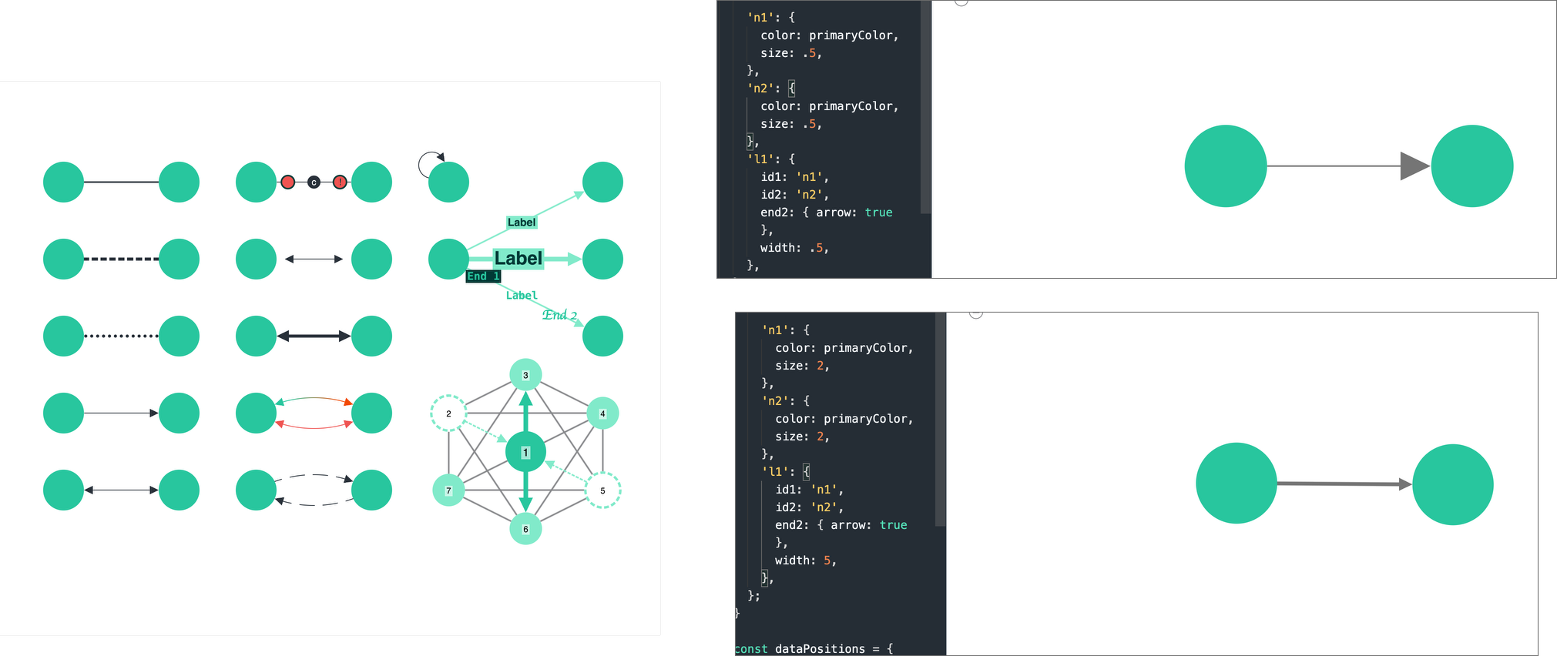
I worked with engineering and product to find technical solutions that would enable our vision to render in a browser. We explored different solutions, and I evaluated capabilities and documentation along with engineering. After testing speed, performance, flexibility, and dev support, we settled on Regraph.
Leveraging the Regraph sandbox, I tested customization features against our designs, and even sent working layout code to engineering to accelerate development.
Data ontology
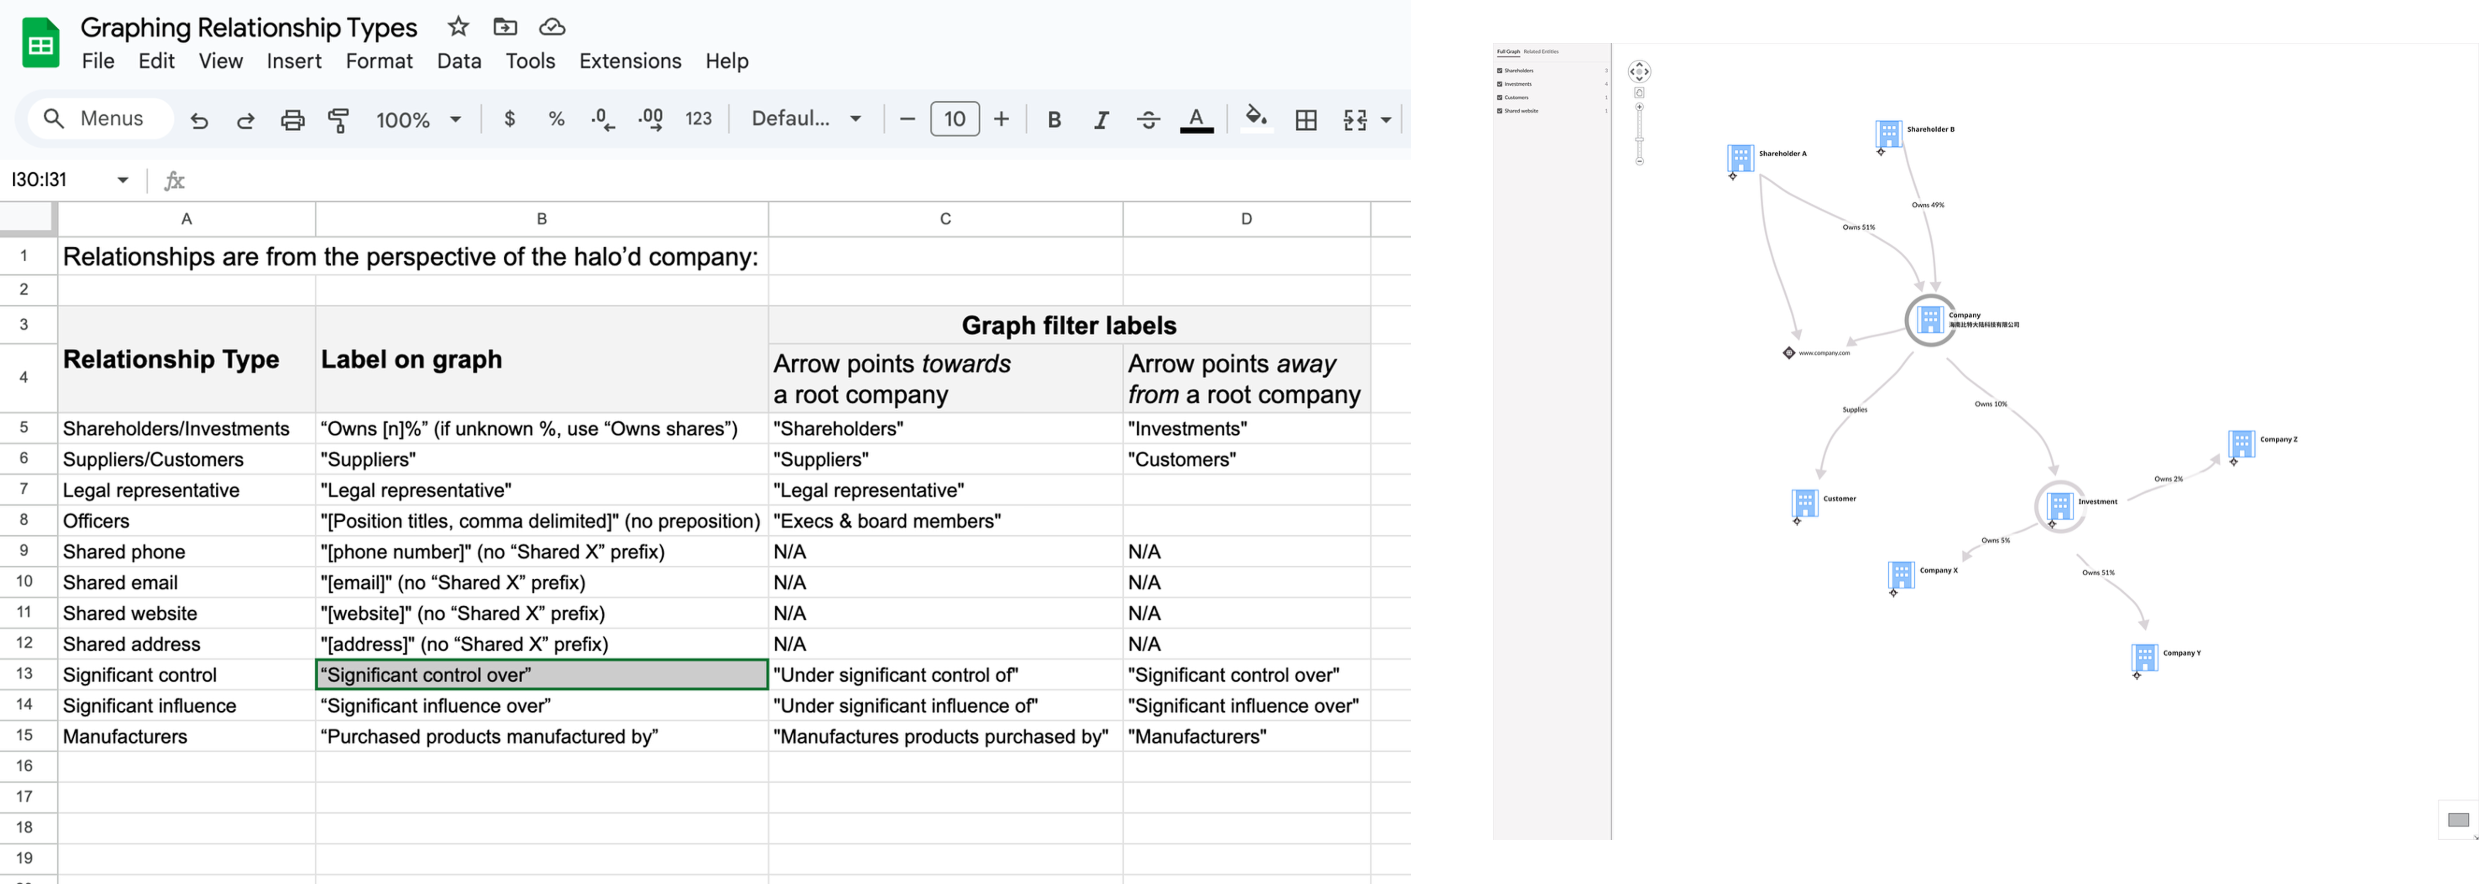
As graphs scaled redundant relationships edges started to add visual noise (e.g., investor A to company B was also investment B from company A). To reduce these two-way edges but still maintain accurate relationship counts and filters, I created a ruleset that defined how to labeled and rendered graph edges in a way that would be extensible in the future (by features such as WireScreen Pathfinder).
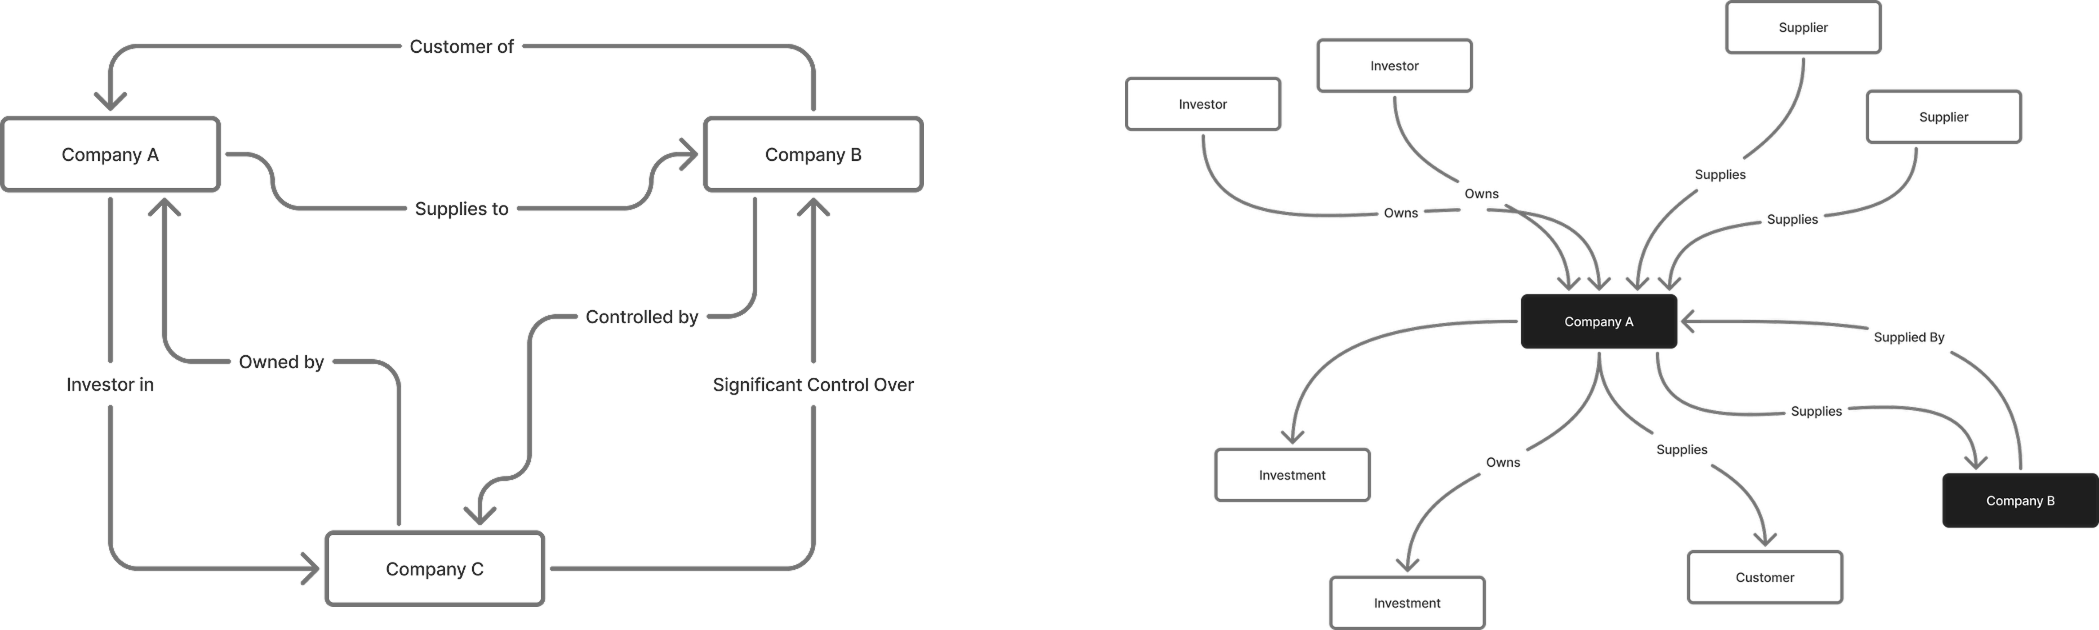
I created a directional ruleset that centered on "root entities" but still worked when we had multiple root entities on the graph. This happens any time a user drilled down and displayed the immediate network graph of a particular entity.
Key features shipped
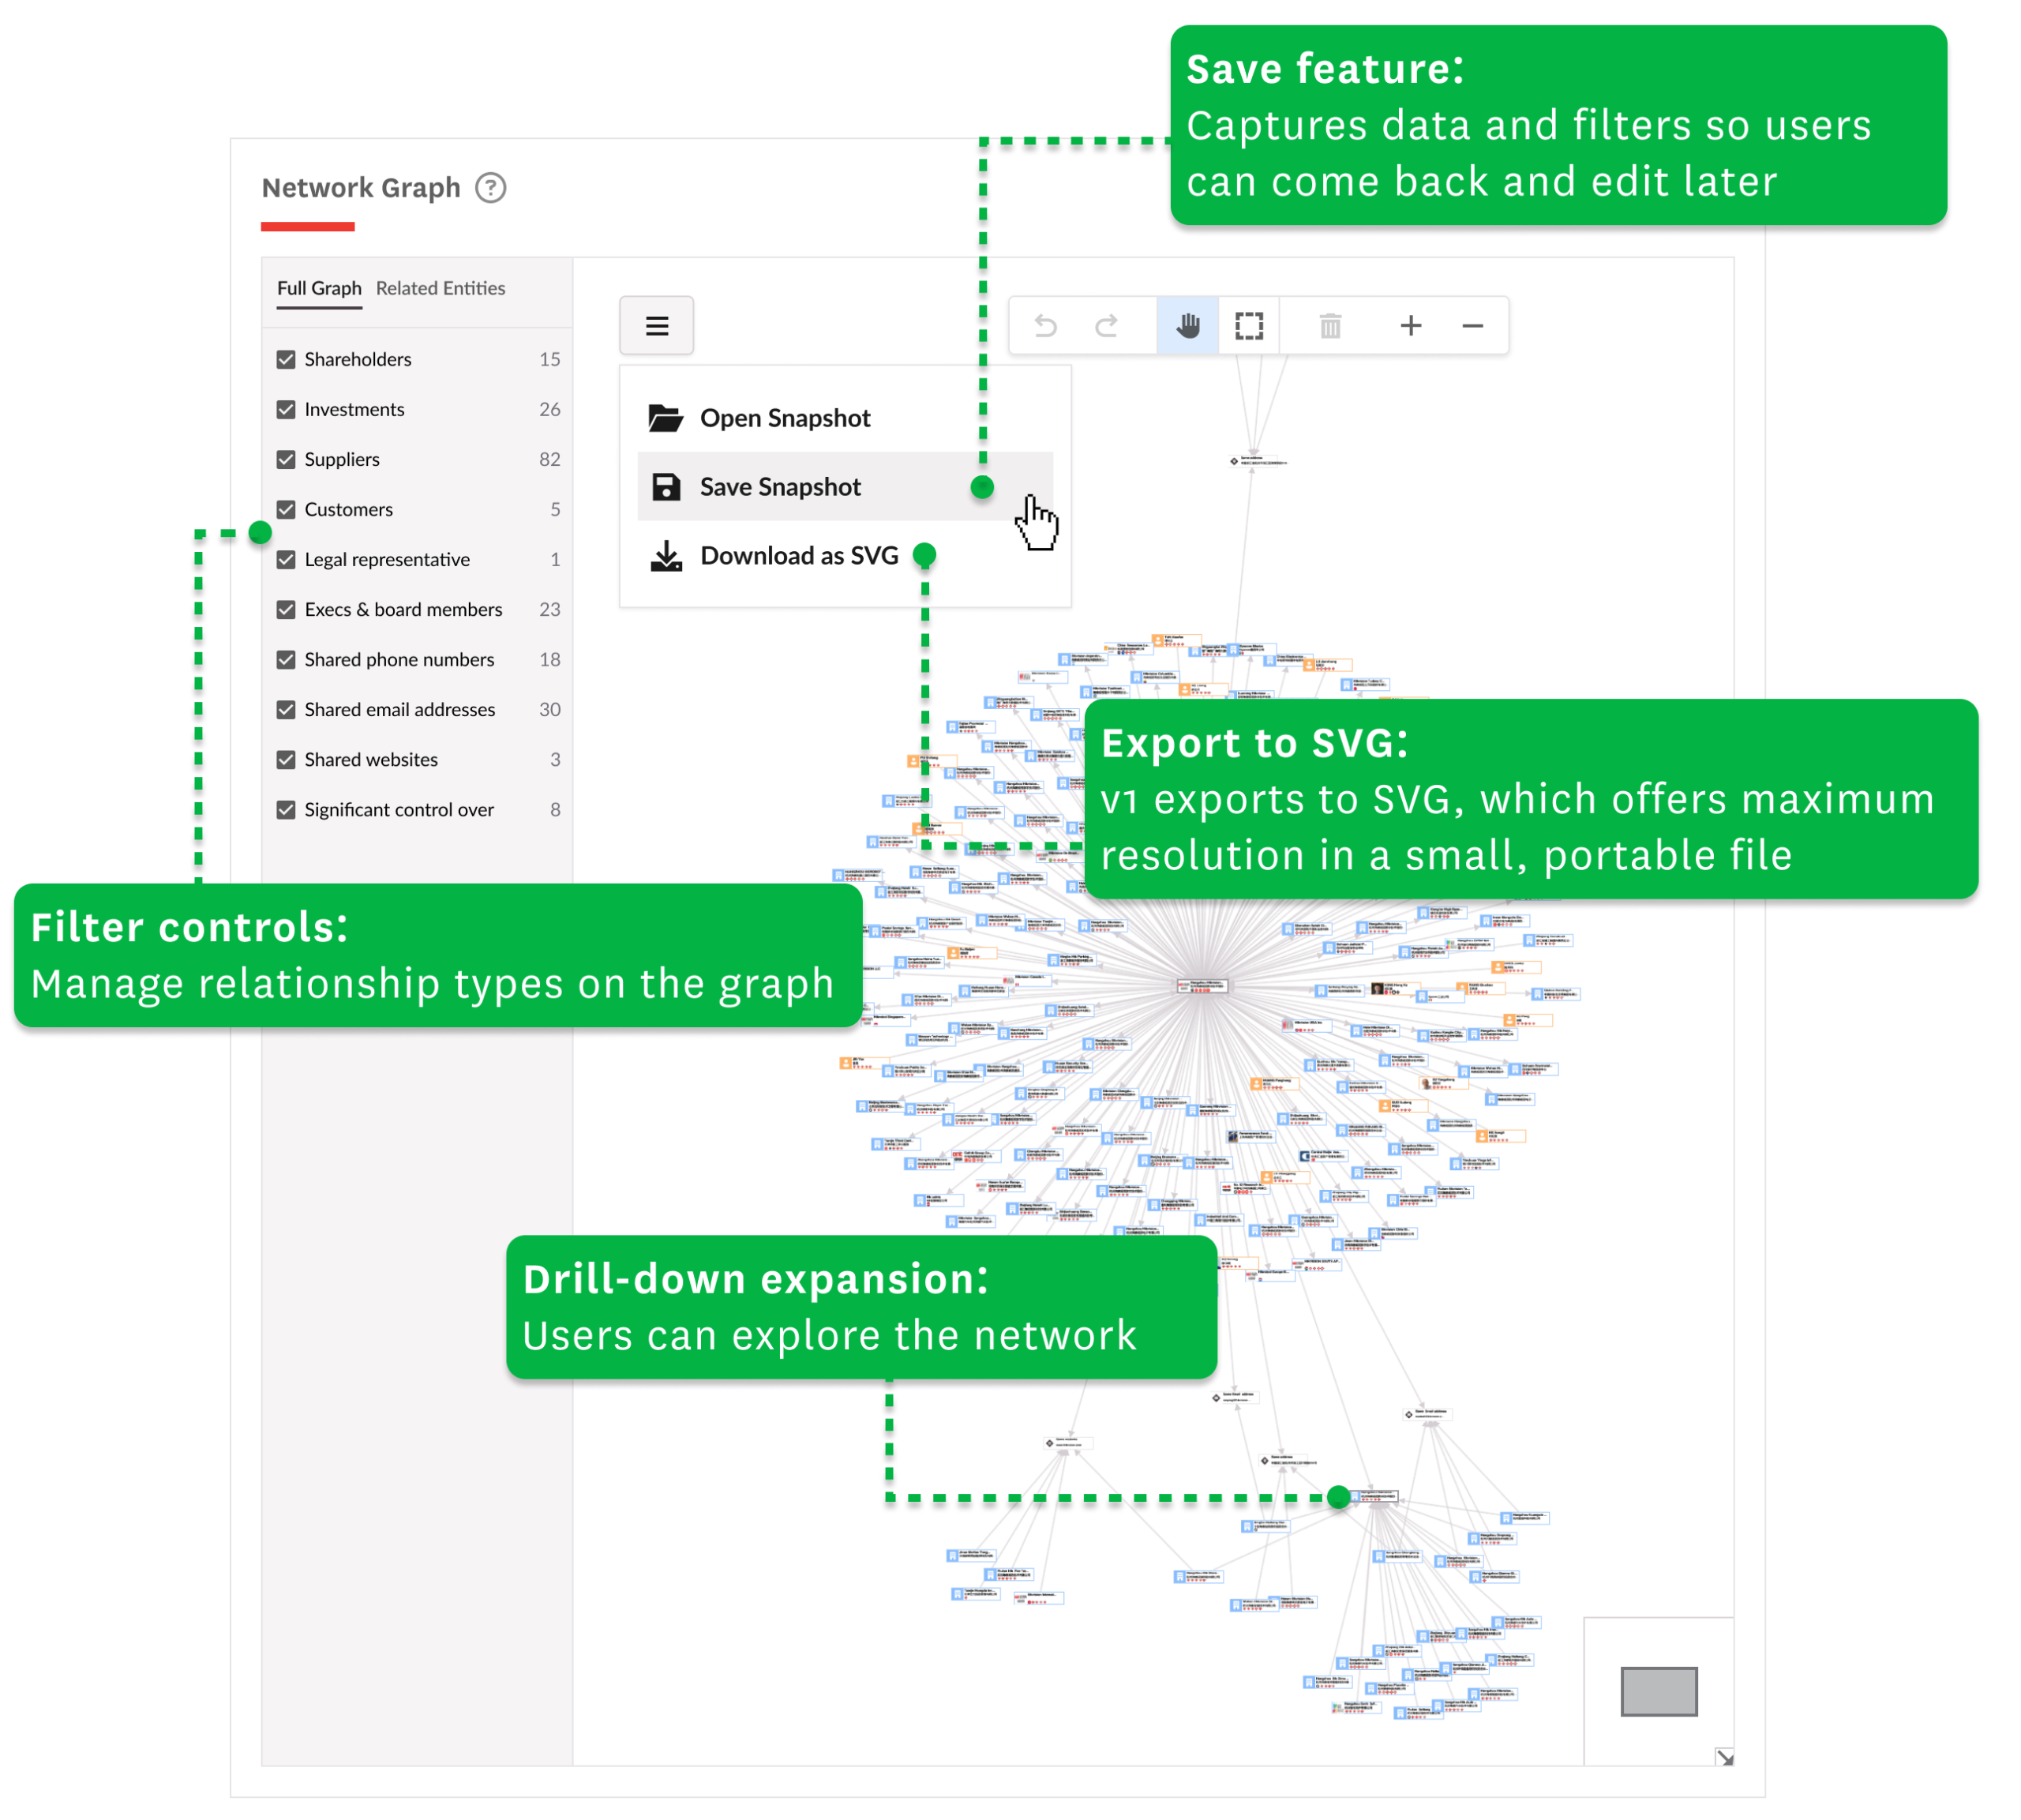
- Drill-down expansion: Analysts can now expand entities directly on the graph, revealing connected companies, executives, and government relationships without leaving the canvas
- Quick-hover validation: Rich hover states surface key entity details (flags, ownership, risk indicators) for rapid validation without breaking investigative flow
- Filtering controls: Users can reduce visual complexity on large entity networks, focusing on relevant relationship types or risk levels
- Save & resume: Manual arrangements and node groupings persist, letting analysts return to in-progress investigations
- One-click export: Clean graph exports eliminated the screenshot-and-stitch workaround
- 'Unified visual language: Circles for people, squares for companies -- matching platform conventions and reducing cognitive overhead when reading complex networks
CUSTOMER impact (AFTER LAUNCH)
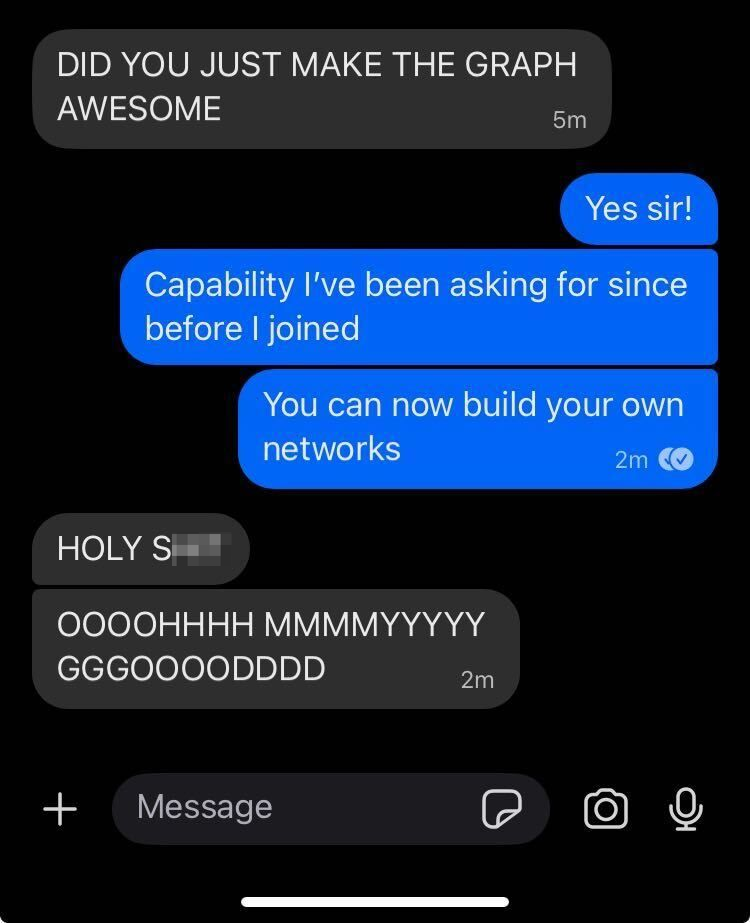
Users of the product were emphatic and praised the new graphing capabilities. This kind of validation is the result of listening to customers, digging into user needs, and thoughtful prioritization of features and functionality, in addition to designing well-thought out UI/UX and user workflows.
- Strong user validation: Customers praised the new graphing capabilities, a direct result of listening to user needs and thoughtful feature prioritization
- New exploration capabilities: Analysts could investigate networks in ways not previously possible, uncovering relationships that were harder to surface before
- Accelerated sales cycles: Sales teams built and saved complex graphs to demo with prospects; visual "wow factor" helped close deals ("never seen it dynamically graphed this way before")
- Enhanced deliverables: SVG export enabled analysts to include WireScreen visualizations in reports, and helped prospects create shareable assets for internal decision-makers during trials
before / after